
A practical guide to scaling the Model Context Protocol (MCP) in production.
Model Context Protocol (MCP) provides a standardized way for AI assistants to interact with external tools such as Jira, billing systems, CRMs, and internal APIs. An MCP server can expose hundreds of tools. In our case, a single server exposed around 768 tools, and we were running multiple servers of similar size.
At small scale, MCP feels straightforward. As the number of tools grows, however, the challenge shifts from integrating tools to helping the model reliably choose the right one.
If you're working with more than 50 tools, or planning to expose hundreds through multiple MCP servers, this article shares the architectural patterns and operational lessons that helped us scale while maintaining reliability and performance.
Introduction
MCP defines a simple contract between an AI application and external systems:
- Discover available tools
- Invoke a tool
- Receive structured results
Initially, everything feels clean. You connect Jira, then your billing platform, followed by another internal API as its own MCP server. The assistant becomes increasingly capable, and the team quickly sees the value.
Then the numbers grow.
In our environment, one MCP server exposed nearly 768 tools, and we had multiple servers of comparable size. Instead of managing a handful of tools, we were suddenly dealing with thousands of tool definitions.
The protocol itself scales well. The challenge is helping the model consistently select the correct tool from a very large collection.
With around 10–15 tools, the model can usually consider every option effectively. Beyond 50, overlapping names and descriptions begin to introduce ambiguity. Once you're managing hundreds of tools across multiple servers, entirely new operational challenges emerge:
- Incorrect tool selection
- Higher latency
- Large prompt sizes
- Difficult debugging
- Invalid or hallucinated tool calls
MCP intentionally standardizes how tools are exposed and invoked. It does not determine which tools should be available to the model for a given request. That responsibility belongs to your orchestration layer.
The Breaking Point
As our deployment grew, several production challenges became increasingly common.
Tool Selection Becomes Ambiguous
Many tools differed only by resource type or a small variation in operation. With hundreds of similar names, the model occasionally selected a tool that looked appropriate but wasn't the correct one, resulting in empty responses or incorrect actions.
Latency Increases
Tool discovery, schema processing, and candidate ranking all introduce latency. If every user request performs full discovery across every server, both time-to-first-token and overall response time increase significantly.
Prompt Size Grows Rapidly
Loading hundreds of tool definitions into the model consumes valuable context window before the user request is even processed. Larger prompts increase token usage, cost, and often reduce tool selection quality.
Debugging Becomes Harder
When a request fails, you need immediate visibility into:
- Which MCP server handled it
- Which logical tool was selected
- Which wire-level tool was invoked
- Which arguments were passed
- Which user session triggered the request
Without structured logging, production debugging quickly becomes difficult.
Hallucinated Tool Calls
At larger scales, models are more likely to:
- invent parameters
- use invalid enum values
- call tools that aren't available on the selected server
Strict validation becomes essential.
A Production Lesson
One experience made these challenges very clear.
We connected a large internal API through MCP for a demonstration, exposing every available tool. On paper, it looked powerful.
Then someone asked: "Show my open tickets."
The model selected a tool whose name closely matched the request, but it was intended for a different resource type.
Technically, everything worked.
The MCP JSON-RPC request succeeded.
No exceptions were thrown.
The internal API behaved exactly as designed.
The result was simply empty.
We spent nearly an hour checking permissions, rate limits, and API logs before discovering the real problem.
It wasn't an infrastructure issue.
It was tool routing.
That experience reinforced an important lesson:
A successful MCP call at the protocol level does not necessarily mean the user received the correct answer.
That realization fundamentally changed how we approached tool selection.
Design Principles That Helped Us Scale
Rather than exposing every available tool equally, we adopted a few guiding principles.
Tool Abstraction and Scoping
Treating 768 tools as equal options inside the prompt creates unnecessary confusion.
Instead, group tools by:
- read vs. write operations
- product area
- business domain
- risk level
Only expose the subset relevant to the current request.
Standardize Inputs and Outputs
Whenever wrappers are under your control, normalize:
- errors
- pagination
- empty results
- success messages
Consistent responses help models develop more reliable reasoning patterns across different tools.
Use Consistent Naming
Even if underlying APIs generate complex wire names, use logical names and descriptions that match the language used by your documentation and support teams.
Consistency improves both routing accuracy and debugging.
Build Observability First
Before adding more MCP servers, make sure every tool invocation can answer questions like:
- Which server handled the request?
- Which logical tool was selected?
- Which wire-level tool was called?
- How long did it take?
Production systems become much easier to operate when observability is designed from the beginning rather than added later.
How Our Architecture Evolved
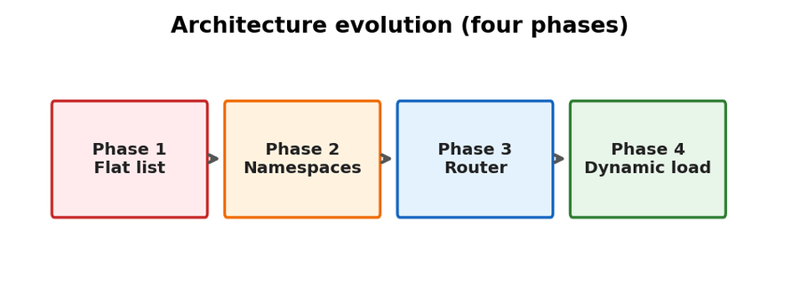
We didn't arrive at the final architecture immediately. It evolved through several stages.
Phase 1 — Load Everything
Initially, we exposed every tool from every MCP server directly to the model.
Advantages
- Simple implementation
- Easy to understand
Trade-off
Works well for prototypes but becomes increasingly difficult to manage as tool counts grow.
Phase 2 — Group by Domain
Next, we organized tools by:
- server
- product
- business domain
- intent
Not every tool needed to appear in every prompt.
Trade-off
Reduced confusion significantly, but cross-domain requests still required additional routing logic.
Phase 3 — Intent-Based Routing
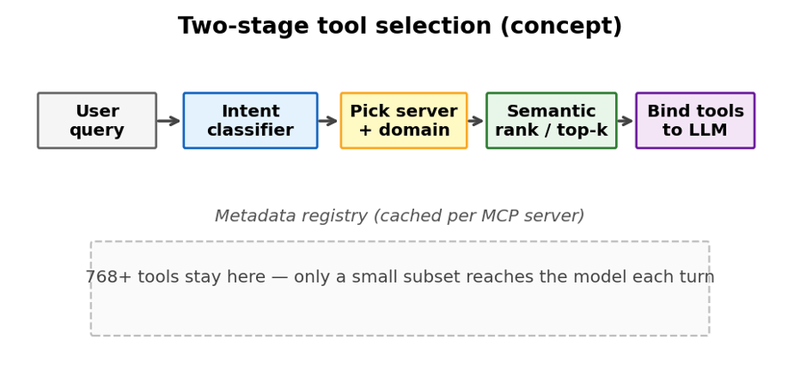
We introduced a two-stage workflow:
- Identify user intent.
- Load tools only from the relevant server and select the top-ranked candidates.
This dramatically reduced both prompt size and incorrect tool selection.
Phase 4 — Dynamic Context-Aware Loading
Today, tools are attached to the model only for the current request based on:
- user message
- user role
- connected applications
- available MCP clients
A router selects the appropriate server, and a ranking layer chooses a small subset of tools.
Although this architecture introduces more moving parts, it prevents hundreds of unnecessary tool definitions from entering the model's context.
Practical Techniques That Worked
Tool Registry
Maintain a registry that maps each MCP server to its tool metadata.
Refresh periodically and cache results so temporary server issues don't delay every conversation.
Metadata-Driven Routing
Use lightweight signals such as:
- intent
- application
- user role
before performing more expensive retrieval.
Embedding-Based Tool Selection
Embed both tool descriptions and usage metadata.
Retrieve only the most relevant candidates—typically 5–20 tools—instead of presenting hundreds to the model.
Caching and Rate Limiting
Cache list_tools() responses whenever possible.
Rate-limit execution per user and per server to protect backend services.
Parallel vs Sequential Execution
Run independent read operations in parallel.
Execute dependent workflows sequentially when later steps rely on earlier outputs or when write operations must remain ordered.
Safe Fallbacks
If intent classification has low confidence:
- ask one clarification question
- fall back to a safe default
- log the event for future analysis
Avoid guessing among hundreds of similar tools.
Simplified Design Example
The following Python-style pseudocode illustrates the overall approach.
class ToolRegistry:
    def __init__(self):
        self.by_server = {}

    async def ensure_loaded(self, server_name, mcp_client):
        if server_name not in self.by_server:
            tools = await mcp_client.list_tools()
            self.by_server[server_name] = [
                parse_tool(t, server_name)
                for t in tools
            ]
        return self.by_server[server_name]


async def select_tools_for_turn(user_query,
                                user_context,
                                registry,
                                ranker):

    intent = await classify_intent(user_query)

    candidates = []

    for server in servers_for_intent(intent,
                                     user_context):
        candidates.extend(
            await registry.ensure_loaded(
                server,
                clients[server]
            )
        )

    topk = await ranker.rank(
        user_query,
        candidates,
        k=12
    )

    return wrap_as_langchain_tools(topk)
For simplicity, this example omits retries, validation, timeout handling, and error recovery.
Observability and Debugging
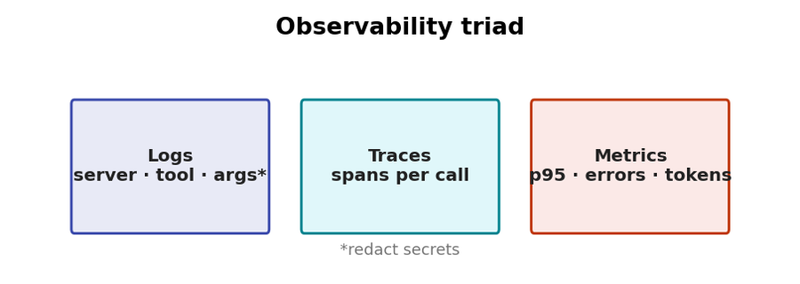
Reliable operations require more than successful tool execution.
Logging
Capture at minimum:
- correlation ID
- server name
- logical tool name
- wire tool name
- redacted arguments
- latency
- outcome
Tracing
Treat each tool invocation as a trace span:
User Request
→ Tool Selection
→ MCP call_tool
→ Tool Response
Metrics That Matter
The metrics that proved most useful included:
- tool selection accuracy
- p95 latency for list_tools
- p95 latency for call_tool
- token usage before and after dynamic loading
- error rate by server
- error rate by tool family
A Scalable MCP Blueprint
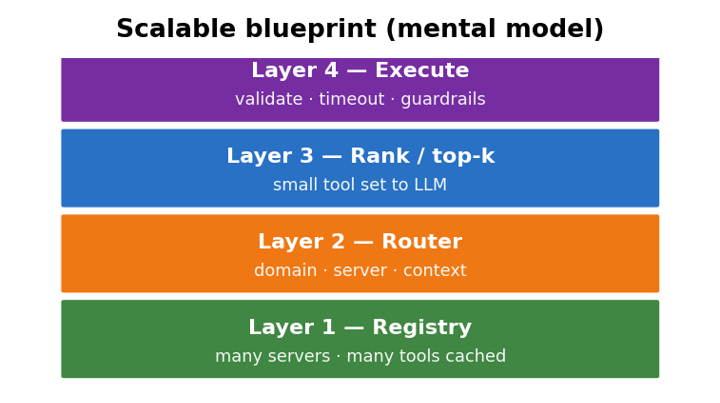
Our production architecture now follows four layers.
Layer 1 — Registry
Store metadata for every MCP server and tool outside the model prompt.
Layer 2 — Router
Select the relevant server using lightweight routing signals.
Layer 3 — Retriever
Retrieve only the most relevant tools—typically 5 to 20, not hundreds.
Layer 4 — Executor
Execute tools with validation, guardrails, retries, timeouts, and full observability.
Maintain stable internal tool identifiers even when MCP server implementations evolve. Version metadata so routing remains reliable as servers change.
Conclusion
MCP makes tool integration consistent, but consistency alone does not guarantee scalability.
As tool ecosystems grow, disciplined routing, selective tool exposure, metadata management, and strong observability become essential for maintaining both performance and reliability.
One lesson stood out throughout our journey:
The goal is not to expose every available tool to the model. The goal is to consistently expose the right tools at the right time.
For teams building production AI systems, that distinction often makes the difference between an assistant that works in demonstrations and one that remains reliable at scale.