“Interactive, responsive, and easy-to-integrate charting solutions for your Angular dashboards.”
Data visualization isn’t just about pretty charts—it’s about making complex data easy to understand and actionable. For Angular developers, NGX-Charts offers a powerful, flexible, and developer-friendly way to build beautiful and interactive charts. Whether you're building admin dashboards, analytics platforms, or monitoring tools, NGX-Charts helps you create a seamless and rich data experience.
Why NGX-Charts Among Other Libraries?
Choosing the right library to handle all features is a crucial aspect of Angular projects. Here's why we chose NGX-Charts over other libraries:
- Angular Compatibility: Designed specifically for Angular projects.
- Ease of Use: Ready-to-use components offer easy chart creation, unlike the more complex D3.js.
- Customizability: Offers significant customization without complexity.
- Accessibility Features: Built-in ARIA compliance ensures inclusivity.
- Active Community Support: Maintained by Swimlane with frequent updates and documentation.
Chart Types Overview:
The supported chart types in NGX-Charts include Line, Area, Bar, Horizontal bar, Pie, Donut, Gauge, Heat map, Bubble chart and other variations.
- Bar & Horizontal Bar – great for category comparisons
- Line & Area – visualize trends over time
- Pie & Donut – show proportions or distributions
- Gauge – track performance or progress
- Heatmap – visualize density or patterns
- Bubble – multi-variable relationships
Installation Guide:
To get started, install NGX-Charts and the Angular animations module:
Run the following commands in terminal/CLI
npm install @swimlane/ngx-charts --save
npm install @angular/animations --save
After Successful installation, import them to our component as shown below:
app.module.ts:
import { NgModule } from '@angular/core';
import { BrowserModule } from '@angular/platform-browser';
import { BrowserAnimationsModule } from '@angular/platform-browser/animations';
import { NgxChartsModule } from '@swimlane/ngx-charts';

@NgModule({
  declarations: [],
  imports: [
    BrowserModule,
    BrowserAnimationsModule,
    NgxChartsModule
  ],
  bootstrap: []
})
export class AppModule { }
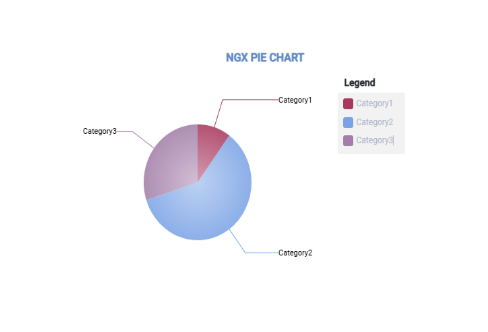
Pie Chart:
app.component.html :
Based on the chart preference html tag will be changed. To implement a pie using NGX-Charts with a dataset then html tag will be
<ngx-charts-pie-chart>
In the HTML component by using property binding, we can pass a dataset along with custom inputs to NGX-Charts tag to get the output and simultaneously we have event emitters to catch the respective changes in the graph.
In the following example
We are passing inputs like view, results…etc from app.ts
app.component.html:
< ngx-charts-pie-chart
  [view]="[500, 300]"
  [results]="single"
  [gradient]="gradient"
  [legend]="showLegend"
  [labels]="showLabels"
  [doughnut]="false"
  (select)="onSelect($event)"
  (activate)="onActivate($event)"
  (deactivate)="onDeactivate($event)" >
< /ngx-charts-pie-chart >
app.component.ts:
* Options of Chart
*/
gradient: boolean = true;
showLegend: boolean = true;
showLabels: boolean = true;
legendPosition: string = 'below';

single: Array<{ name: string; value: number }> = [
  { name: 'Category1', value: 10 },
  { name: 'Category2', value: 60 },
  { name: 'Category3', value: 30 }
];

onSelect(data: any): void {
  console.log(data);
}

onActivate(data: any): void {
  console.log(data);
}

onDeactivate(data: any): void {
  console.log(data);
}
Run ng serve command on CLI/Terminal to connect the server and successful execution open http://localhost:4200/ on browser to view the bar graph.
Output:
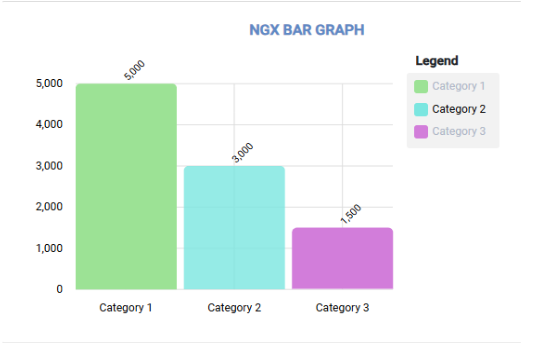
Bar Graph:
To implement bar chart using NGX-Charts then html tag will be
<ngx-charts-bar-vertical>
In following example, few inputs values are passing from app.ts file and for remaining inputs like x-axis..etc are directly assigning in the app.html itself.
We can also customize the styling by importing the respective packages from @swimlane/charts.
import { Color, ScaleType } from '@swimlane/ngx-charts';
app.component.ts:
colorScheme: Color = {
  domain: ['#9ce295', '#7be6e0', '#d27dda'],
  name: 'customScheme',
  selectable: true,
  group: ScaleType.Ordinal
};

chartData = [
  { name: 'Category 1', value: 5000 },
  { name: 'Category 2', value: 3000 },
  { name: 'Category 3', value: 1500 }
];
app.component.html:
< div class="div_sublevel">
   < span class="title">NGX BAR GRAPH< /span>
 < /div>

< ngx-charts-bar-vertical
   [view]="[500, 300]"
   [scheme]="colorScheme"
   [results]="chartData"
   [gradient]="false"
   [xAxis]="true"
   [yAxis]="true"
   [legend]="true"
   [showDataLabel]="true" >
 < /ngx-charts-bar-vertical >
Output:
Drilldown:
While NGX-Charts doesn't provide built-in drilldown support, we can simulate it by updating chart data based on user interaction events.
To implement a drilldown feature using NGX-Charts, we can follow the approach of displaying an initial chart (bar chart) and then loading more detailed data into another chart (pie chart).
app.component.ts:
barChartData = [
  { name: 'Category 1', value: 100 },
  { name: 'Category 2', value: 200 },
  { name: 'Category 3', value: 300 }
];

pieChartData: any[] = [];
showDrilldown = false;
category: string;

drilldownData: any = {
  'Category 1': [
    { name: 'Subcategory 1.1', value: 50 },
    { name: 'Subcategory 1.2', value: 30 },
    { name: 'Subcategory 1.3', value: 20 }
  ],
  'Category 2': [
    { name: 'Subcategory 2.1', value: 120 },
    { name: 'Subcategory 2.2', value: 80 }
  ],
  'Category 3': [
    { name: 'Subcategory 3.1', value: 150 },
    { name: 'Subcategory 3.2', value: 100 },
    { name: 'Subcategory 3.3', value: 50 }
  ]
};

onBarSelect(event: any): void {
  this.category = event.name;
  this.pieChartData = this.drilldownData[this.category] || [];
  this.showDrilldown = true;
}
app.component.html:
< div class="div_sublevel" >
  < span class="title" >Drilldown Example< /span >
< /div >

< ngx-charts-bar-vertical
  [view]="[700, 400]"
  [results]="barChartData"
  [xAxis]="true"
  [yAxis]="true"
  [legend]="true"
  [showXAxisLabel]="true"
  [showYAxisLabel]="true"
  [xAxisLabel]="'Category'"
  [yAxisLabel]="'Value'"
  (select)="onBarSelect($event)" >
< /ngx-charts-bar-vertical >

< div class="div_sublevel" >
  < span class="title">{{ category }}< /span >
< /div >

< ngx-charts-pie-chart
  *ngIf="showDrilldown"
  [view]="[700, 400]"
  [results]="pieChartData"
  [legend]="true"
  [explodedSlices]="true"
  [labels]="true"
  [doughnut]="false" >
< /ngx-charts-pie-chart >
output:
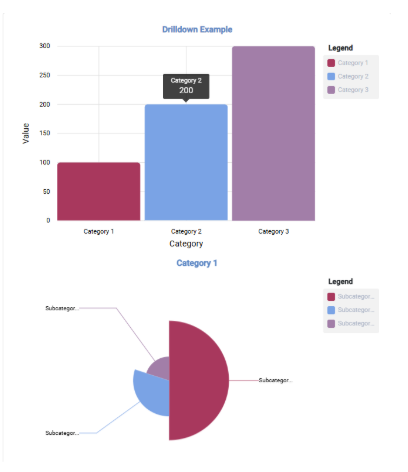
Initially, a bar graph will be displayed, once user starts interact with main graph, then bar graph will be displayed based on user interaction.
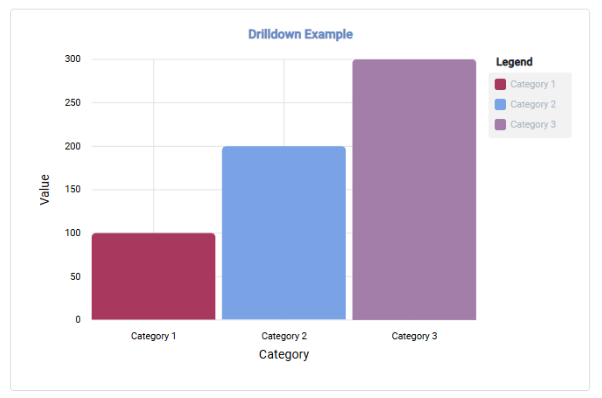
If the user clicks on Category 1, the following pie chart will be displayed as a drilldown.
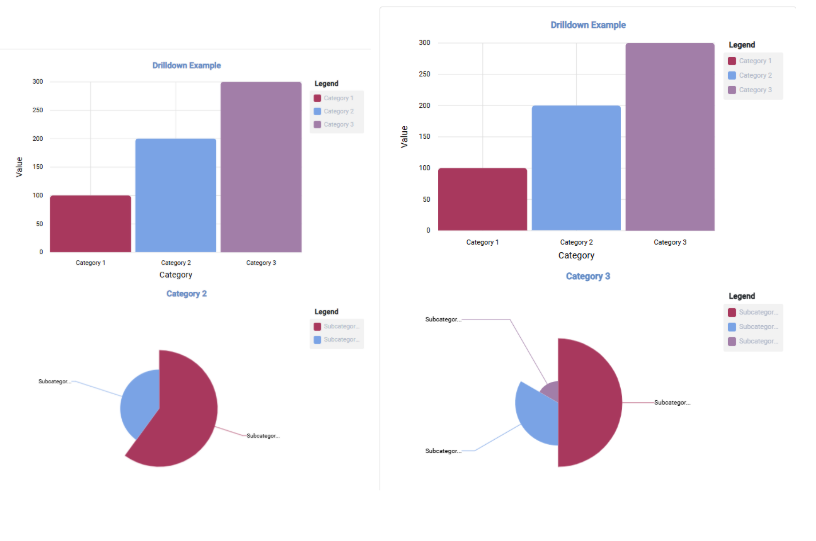
Similarly, when the user clicks on Category 2 or Category 3, the respective charts will be displayed as shown below
Conclusion:
NGX-Charts is an excellent choice for Angular developers looking to add engaging and interactive charts to their applications. Its simplicity, combined with powerful features, makes it a great tool for most visualization needs.
Ready to enhance your Angular application with NGX-Charts? Give it a try and share your experiences in the comments below!
For inputs/directives click here
Reference Link for NGX-Charts: https://swimlane.gitbook.io/ngx-charts